|
Welcome back to part 3 of this investigation series. I don’t know how to select the picture that pops up when I post an article. It always shows the first picture in the article. So here’s a Bacillus Bunny. I’ll get to how it’s relevant by the end. 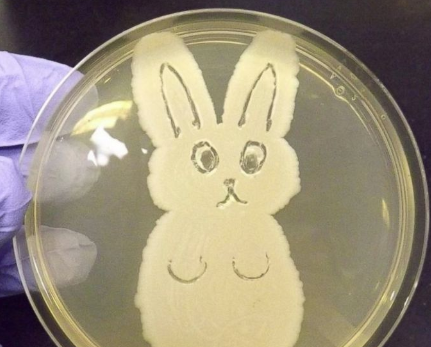 Part 1 of this series presented the bioburden issue. Part 2 discussed the team we put together and our initial findings. In part 3, I want to go over what our team did. During the equipment swabbing party, the team noticed multiple gaskets in poor condition. These gaskets were viewed as one source for harboring the organism, allowing it to proliferate between and during each run. The engineering specialists focused on remediating that issue short term (gasket replacements) and long term (better preventative maintenance). They even brought in an outside contractor to run a special cleaning agent through the lines after all this maintenance was performed. This was all done between the last engineering run and the first commercial run. Despite these gasket issues-
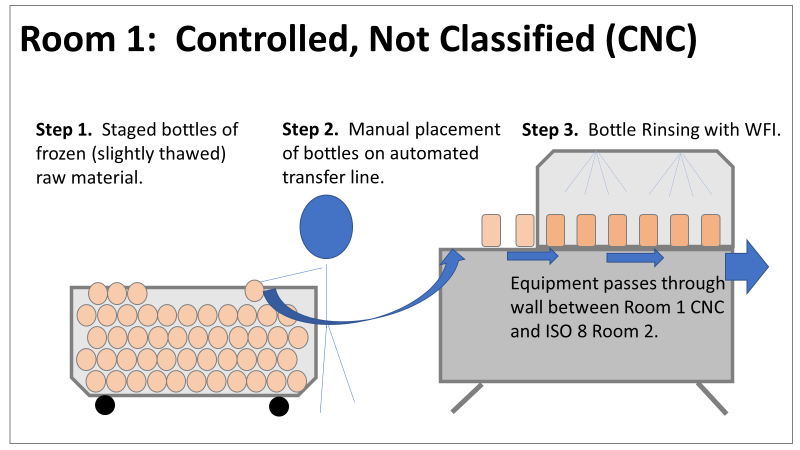
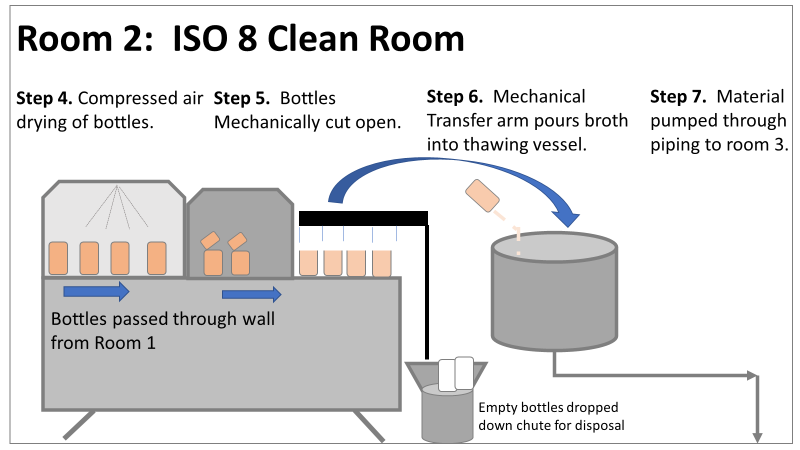
Therefore, most investigation time focused on the organism’s source: either room 1 in the CNC or room 2 in the ISO 8 area. As a reminder, this is what those rooms looked like.
This investigation got the attention and resources of a final product sterility failure. Since the source of the organism was unknown, it was also investigated like a sterility failure. The micro experts were VERY good at pointing out non-sterile aspects of Rooms 1 and 2. That was evident during the brainstorming session of the Analyze phase of the investigation. The team spent a month performing the investigation this way. We swabbed all over these rooms and never found the same organism. Recovery of any Bacillus species were rare. We collected water samples directly from the conveyor belt rinsing station. We pored over manual cleaning practices for any imperfection in procedure. We spent way too much time seriously discussing the possibility that:
Also- What’s the most obvious non-sterile aspect of these rooms? People! The team’s hypotheses were filled with different ways of blaming people.
Manpower flooded our 6M fishbone diagram. Blaming manpower is a pet peeve for me. But the most frustrating part- All hypotheses were investigated individually when we could have addressed them all as a single question: Could contamination from an unseen/unnoticed source in Room 1 or Room 2 have caused our OOL Results? For perspective on that question, let's do some math! 250 colonies is the limit that can be visually differentiated on a test plate. When there are more colonies on the plate, they start to grow into each other. Recoveries greater than 250 are considered too numerous to count. Therefore, test results were documented as >250 CFU(colony forming units)/mL Multiply 250 CFU/mL by 1000mL/L, and you have 250,000 CFU per liter. A batch of this raw material is 7000 liters. Assuming the organism was evenly distributed (based on our ultimate root cause, it likely was), we had 1,750,000,000 CFUs. That’s over 1 billion colony forming units in the pooling vessel at the time of sample collection. Billion, with a B. The background for this next value gets a little fuzzy, so reach out to me if you want to know my reasoning on it. A small, single colony of Bacillus on a test plate contains roughly (very roughly) 1 million cells. That means a single test filter covered in Bacillus contains about 250 million bacterial cells. Remember the Bacillus Bunny? check it out to see what 250 million bacterial cells looks like. Test filters are about the size of the Bacillus Bunny’s belly. Imagine taking seven test filters covered in Bacillus, scraping all the organisms off, then rolling that mess into a ball. It’d be roughly the size of a large marble. That’s what 1.75 Billion CFUs would look like with no vector (dirt, water, fabric, etc…) involved.
The entire team of microbiologists should have been extremely skeptical of any root cause hypothesis that required this much bacteria to be introduced during the manufacturing process. That level of contamination doesn’t happen when an operator holds a non-sanitized glove over an open tank (or any of the other guesses above). We should have been especially skeptical of that much bioburden being introduced to the product stream without the vector being noticed. It’s possible some proliferation occurred between the cleaning cycle and sample collection. But the temperature of the manufacturing lines was controlled at 0°C. Organisms can grow at that temperature, but a quick change to such a stressful environment is hard on microbes. They are not likely to grow to such huge levels so quickly after that transition. I was met with some resistance when I pushed back against the momentum of the investigation. According to our black belt facilitator, we were to follow up on all brainstorming outcomes. Resisting that made me look like I wasn’t a team player. Also, I couldn’t say making the process cleaner was a bad thing. The team had a lot of comfort improving what they could control, especially when we were finding less than optimal practices. But cleaning up non-sterile practices wasn’t the goal of the investigation. This process was designed to function in a non-sterile environment. We needed to know why our counts were so consistently high. After the 2nd failing commercial run, the team started to feel defeated with their efforts. As the team got more desperate, my idea for a unique test got some traction. I drew from experience with CIP cleaning validations to design a test that finally gave us a meaningful lead. You’ll get to read all about it in Part 4! Also, Part 5 is now complete! Credit to this ABC News report where I found the Bacillus Bunny picture. It was originally posted on the American Society for Microbiology's facebook page.
0 Comments
Leave a Reply. |