|
I got flashbacks reading about the technology used for coronavirus vaccines. What’s my connection to the vaccines? The lipid membrane delivery system. It’s a really cool bio-technology used for drugs that need to get into certain cells to work, but the drug has issues getting into those cells. The lipid membranes are made of the same molecules as our cell membranes. The cell absorbs the lipids and lets the drug inside just like the picture below. Follow the RNA vaccine path from the top right. There’s a more intense description in the article I stole the picture from:  I worked with a chemotherapy drug that used a membrane like this. The generic version of the drug, which consisted of just the active ingredient with no membrane, had intense side effects. The side effects were drastically reduced with the lipid membrane delivery system. Instead of the drug running rampant in the blood stream, it was delivered directly into the cells of the target organ. It’s an amazing medicine.
When I started working in a micro lab, I was trained to test this drug for bioburden. If you don’t know what bioburden testing is or why we do it, this should catch you up. For a significant number of lots, the liquid drug product wouldn’t filter and the test wouldn’t work. The goal of filtering is to retain all cells on the filter. The problem with the lipid membranes- they form mini cell-like structures, almost on the same scale as the microbes we’re trying to retain. We’d run the vacuum powering the filtration process for hours at a time. A small amount of liquid slowly passed through the filter. The rest sat in the filter funnel indefinitely. The problem was hidden for years. Eventually, analysts determined the test could not be performed for some lots. At first, small investigations were written for these lots, treating them as one-offs with minimal risk. Ultimately, the analysts made it known they were having a problem and prompted a serious investigation. You may have a lot of questions on how we let this issue fester for so long. The general answer: this was the type of company that was responding to an FDA warning letter when I started and received a consent decree 5 years later. But here’s some general notes about the whole problem:
In the end, we never got closure on what exactly caused the filtration issues. Regulatory agencies required 100mL samples of this product tested for 2 different media types. We updated the method to allow for adding the results from multiple test plates based on how much product would pass through each filter. Sometimes only 5-10mL would filter at a time. Other times all 100mL filtered smoothly. The wording of the test method had to be flexible, but it was hard to interpret, just like how I’m struggling to describe it succinctly now. I felt like a failure after this investigation. I got no closure. I also don't have a good way to wrap up this little story, so we can both feel frusted. Now, I hope these lipid membranes aren’t causing similar issues for vaccine bioburden testers around the world.
1 Comment
Bioburden testing is performed on In-Process pharmaceutical products (or any non-sterile product) to quantify and identify micro contamination. The test is performed on a product sample prior to filtration, filling, and any final sterilization cycles. The test lets manufacturers know what types of organisms, and how many, are getting into the product before they’re physically removed or killed off. If they’re physically moved or killed off, why do we need to know if they’re in the product at that stage? Great question!
Bioburden testing is pretty straight forward:
 There are other methods, but this was used for the product I talk about in the unfiltered story. It was the preferred method in the lab at the time. We could test large volumes, as opposed to the pour plate where we could only do 1mL a plate.
But how do we know microbes in the product will show up during this test? The drug may prevent the organism from growing or could even kill the microbes we’re looking for. That may not seem like a big deal – “the drug kills organisms, so we don’t have to worry so much about removing them!”. But re-read the bullet points and you’ll remember why we need to know if organisms were ever there. Back to the question- we know the test works because we validate it. We inoculate a sample with target organisms, test it, then confirm recovering those organisms after incubation. If we do this over multiple lots and recover about as many organisms as we inoculated, we consider the method validated. Other testing kinks get worked out during the validation too. What type of rinse too use, how much rinse, the material in the filter, etc… Hopefully this background helps you understand the test so you can relate to the problem we had. Let’s get you back to the investigation story! Paenibacillus glucanolyticus. I don’t know how every facility doesn’t have to deal with this bug. The bug is pictured below. Any microbiologist would call this plate TNTC (too many colonies to count / >250 CFU/plate). 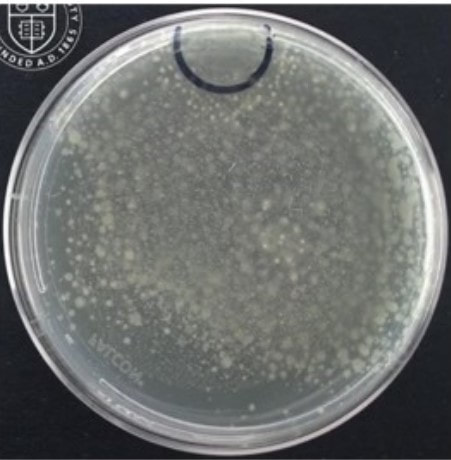 This organism drove me crazy when I was the Plant Hygienist at a soap manufacturing plant. I referenced this event in my previous post about my recent job interview presentation. This issue also fits my series of frustrating quality problems, so I want to expand on it. Our viable air monitoring recovered P. glucanolyticus every other month near a filling line. It was always TNTC! We were required to open a tedious investigation in our quality system each time. How do you find a specific microbe source in a non-controlled warehouse staffed by hundreds of minimally gowned personnel? Let’s set the stage. Imagine a typical warehouse. 40 ft ceilings, exposed steel rafters, vents, and piping. Stamped concrete floor with painted cement brick walls. Active forklifts and whirring equipment with semi-filtered exhausts blowing air in all directions. Hundreds of employees wearing uniform pants and long sleeve shirts. Hair nets and beard covers on everyone, but nobody wore gloves unless directly working with a filler. (Side Note about this environment) There were multiple filling lines in this warehouse. They were “U” shaped like the picture below. Bottles went from a hopper onto the filling line. They were labeled, filled, then packed in boxes. At the end of the line, the boxes were palletized. 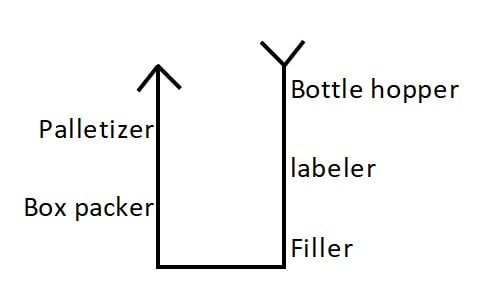 Environmental monitoring didn’t have specifications, but we set action levels based on past data. Higher results signaled something wasn’t normal. The picture below represents multiple lines in the warehouse. We monitored opposing sides of the lines (the colored spots). Most recoveries were "normal" growing bacteria. We had high Paenibacillus counts in the red area.  What was strange- we only got TNTC results if P. glucanolyticus was on the plate. The counts were much lower if it wasn’t there. If the organism was prevalent enough to cause TNTC results, shouldn’t it show up at counts between 1 and 250 sometimes? I found interesting research about the organism. When growing on media, individual cells can migrate away from a starting colony and form their own colonies. When the plate is read 5 days later, the colonies will look completely distinct, like the picture at the top of this post. When multiple cells do this, and multiple cells from those colonies repeat the process, your single CFU at the onset looks like hundreds of colonies after incubation. I’ve since found a time-lapse video that shows this effect. A research team at Cornell created it. They placed a few CFUs in the small circle at the top of the plate. You can see how the organism grows and what the plate looks like at the end. Definitely not the traditional growth pattern with all generations contained in the same colony. I really wish this video existed when I struggled with this organism: Knowing this- knowing your TNTC result was probably representative of only a few CFUs- what do you do next? Can you just say the TNTC result isn’t real and stop the investigation? Unfortunately, we didn’t have time-lapse footage of our plates, so we couldn’t ignore the results. Any individual plate could have been caused by TNTC CFUs. We even had this organism show up as TNTC on a product plate, so we had to discard a batch due to it. This info about the organism made my investigation harder. I couldn’t just look for obvious signs of mass contamination in the area. I now had to find a source in this giant warehouse where the organism was merely surviving. Luckily, a week of expanded EM around the line pin-pointed the source. We collected air samples from multiple locations around the line. We sampled each of those spots every shift for 7 days, averaged the results (setting TNTC to 250), and made a heat map like this:  The bottle unscrambler was in the hottest spot. This chaotic machine somehow transferred bottles from the hopper to the filling line by spinning them around really fast. A maintenance mechanic helped me take it apart and douse it in sporicide. I was told maintenance cleans the unscrambler during the yearly PM, but the presence of a type of bottle that hadn’t been used in 3 years in some of the crevices determined that was a lie.
I worked at this company for another year after cleaning the unscrambler. We didn’t see the organism again during that year, so I’m confident this cleaning (plus the PM cleaning instruction update) was effective. Of course, this organism popped up as TNTC again at the next company I worked for. How have I never heard other Micro labs struggling with it? Microbiologists working in pharma cleanrooms may be horrified picturing this environment. Every product must be contaminated!
This set up is very normal for non-sterile consumer goods. It’s important to note - we did bioburden testing on three samples from every lot made in this warehouse. Our recovery rate - the percent of samples with any micro recovery at all – was less than 2%. That stat includes:
Microbes getting into the product from this open environment was extremely rare. (atleast, microbes that we were able to recover during testing). This knowledge heavily influenced my micro contamination investigations when I returned to pharma manufacturing. Investigators rushing to close their investigation record were quick to blame micro excursions on (heavily gowned) personnel in the area or imperfect cleaning around the time the sample was collected. My time at the soap warehouse taught me those factors aren’t as likely to contribute to an excursion as most microbiologists think. As an extra note- I was proud of the quality assurance at this soap factory. I was especially proud when we made the conservative decision to reject the lot associated with this P.glucanolyticus organism. It was an expensive decision to make. To show my pride, the soap we made was my christmas gift to my extended family the year I worked there. I gave the same gift in the wake of Covid in 2020. We were a contract manufacturer and didn’t own the products we made, so I had to pay full price for all of this. Let's get you back to the original post.  This is the "20 Minute" presentation I gave during my last job interview. I was asked to prepare a presentation about the benefits of genotype identification to a laboratory lead that uses phenotype IDs. I converted the slides and my script/notes into this post. The presentation is pretty bland due to the limited time to make it. This post is LOOONG. and pretty boring. But I think the examples I give in slides 13-16 are pretty interesting. Slide 1: Good Morning! My Name is Jonathan Kallay. Today I’d like to talk with you about your current Microbial identification process and some opportunities for improvement.  Slide 2: I’ve spent the last 12 years in Micro laboratories. I’ve worked with a variety of regulated products. From consumer goods and lab supplies to biopharmaceuticals and small molecule parenterals. I specialize in non-conformance investigations.  Slide 3: From my understanding, you primarily use phenotype identification methods. These methods are often more affordable than Genotype identification in the short-term. However, an investment in genotype testing can improve laboratory and manufacturing performance, leading to significant cost savings in the long run. 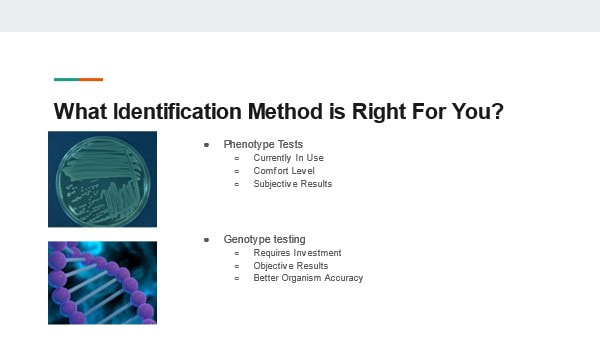 Slide 4: Here’s a quick run-down of what I want to talk about today:
 Slide 5: Phenotype identification is most commonly performed with a combination of colony morphology analysis, Gram stain, and biochemical enzyme reactions. An analyst will inspect a colony on a test plate to determine if the organism is most likely a mold or bacteria. If the organism is a bacteria, it will be subcultured with a gram stain performed on the subculture the following day. Depending on the gram stain result, different biochemical enzymatic tests can be performed to obtain an organism identification. 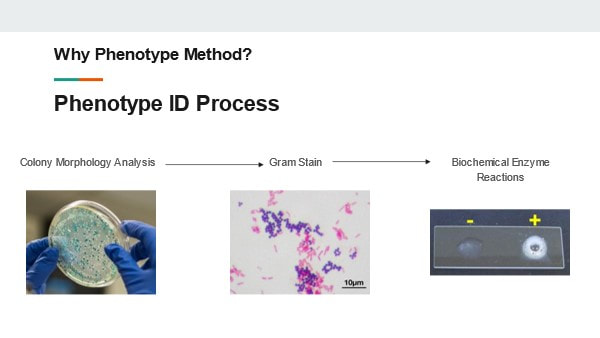 Slide 6: These steps can be pretty effective to get a general understanding of the organisms in your environment.
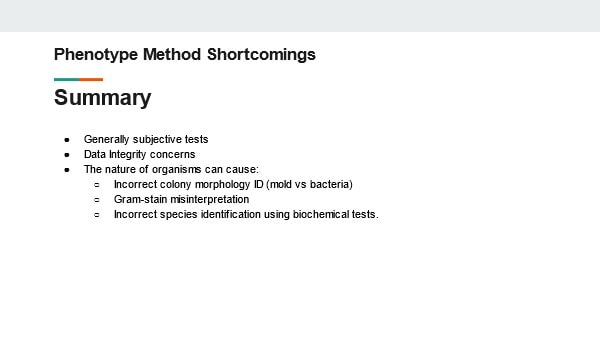
These procedures have been in use for decades. They’re generally considered accurate and have historically been acceptable in the eyes of regulatory bodies. But we need to understand why these tests are insufficient in today’s manufacturing environment 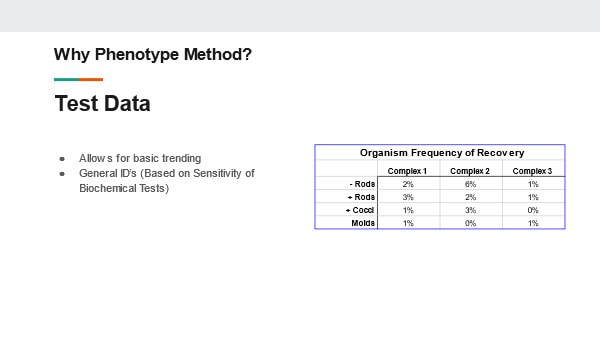 Slide 7: The first short coming I want to talk about: Molds! Why are molds a problem? We determine they’re mold based on how the colony looks. No gram stain is needed. We can even perform some genus level identifications by inspecting the hyphae and fruiting bodies. But not gram-staining IS the problem- There are bacterial colonies that look like mold. For example- Actinomyces species. They grow branches of hyphae just like a fungus. And the name- “Myces” comes from the greek for fungus. It has fooled people looking at it for hundreds of years. If this relatively common organism becomes prevalent in your environment, your search for the source will have you looking for mold, instead of the anaerobic environments these species grow best in. 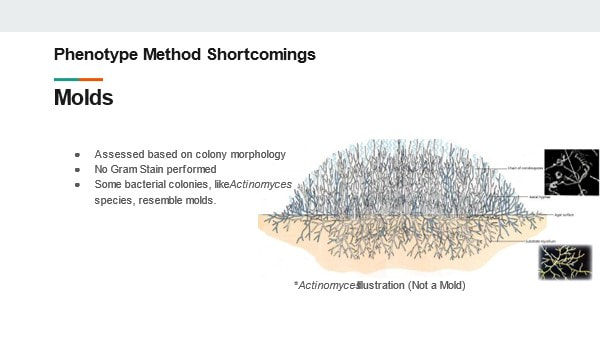 Slide 8: Gram Stains In my experience, the gram stain is the most common phenotype test used in the microbiology lab today. The gram stain result is used for trending and identifying the general source of the organism. It’s also a prerequisite for running biochemical tests. But right off the bat there is a laundry list of things that can go wrong during the gram-stain:
If any of these issues occurred, they’d almost exclusively be blamed on analyst error. Regardless, once the result is generated it’s almost impossible to determine if an error occurred. When a result is generated by an analyst’s interpretation, there is little opportunity to review and verify the result. In the Lab, Data Integrity is the ability to document and verify objective test results. We don’t have this ability for most gram stain methods in use today. 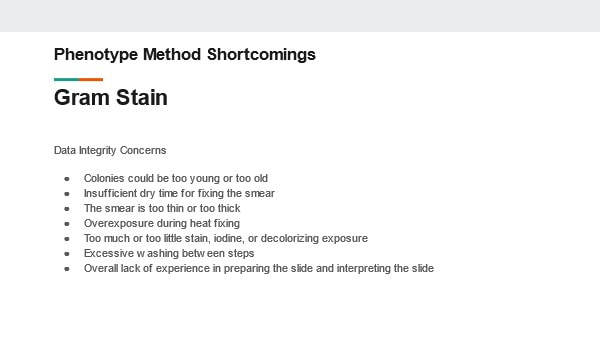 Slide 9 But I want to give the benefit of the doubt that testing issues have been worked out with iron-clad procedures and meticulous technique. Analysts are perfectly trained and able to perform all gram stain steps and readings correctly. That still leaves us with some inherent problems with the test: Gram variable bacteria! They vary in the stains they absorb and retain during the test depending on where each cell is in its growth cycle. That can be the difference between ID’ing the organism as gram positive or gram negative. Even with perfect gram-staining technique, the test can yield both purple and pink cells on your slide. This is common for many Bacillus, Clostridium, and even those same Actinomyces species. Depending on how those colonies are growing on gram-stain day, you could generate either a positive or a negative result for the same species. There are also organisms that vary in shape throughout their life cycle. A common genus is named for this phenomenon- Coccobacillus. These short-rod species appear as little balls (cocci) under a microscope. This is bad news when the laboratory makes an identification decision based on this appearance. The organism will be ID’d as a cocci when the organism shares most other characteristics (like where you're mostly to find it) with other rod species. Let’s not forget, there are some bacteria where gram stains just don’t work. Notably Mycobacterium species. The stains can’t get past the cell wall. Missing the identification for these organisms would be devastating for certain biologic pharmaceuticals. 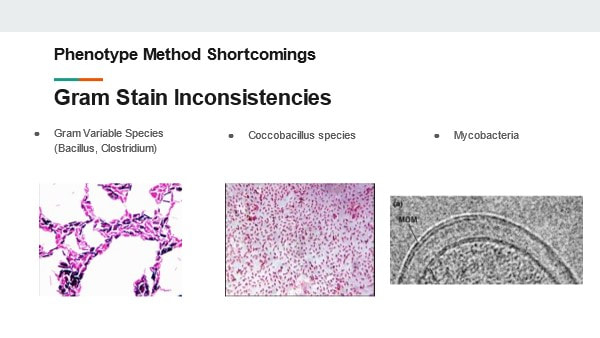 Slide 10: Biochemical tests also fall under the umbrella of phenotype identification. These tests can improve the accuracy of our target organism identification. However, these have some similar technical laboratory issues common for gram stains. For example, something as simple as the catalse test leaves room for interpretation. After mixing hydrogen peroxide with a cell culture, bubbles may appear. Bubbles signal the organism is catalase positive. But what if you see only a few bubbles? Or what if the bubbles originated from physically mixing the peroxide with the culture? This is another subjective measurement that laboratories should strive to eliminate. The way I see it, the bigger problem with these tests is they’re often only as good as your gram stain result. You may determine your organism is gram-negative rod, oxidase positive, and catalase negative (among other enzymatic test results). If the organism was actually a gram-positive rod due to one of the issues we previously discussed, then you assigned an incorrect ID. Even some prominent automated test systems that perform biochemical testing rely on your gram stain result. The gram stain result determines the cartridge you place your organism into for those systems.  Slide 11: To re-hash the shortcomings of these phenotype tests:
 Slide 12: How does genotype testing account for these shortcomings? The answer depends a little bit on the test method used. There are methods that sequence Neuclic acids from the organism. There are also methods that interact with protein in the cells to reflect a protein fingerprint. Both methods compare the results to a library of known, validated organisms. All test results are determined based on objective measurements correlating to the specific nucleotide sequences or protein concentrations in the organisms. The test work for any microorganism. This eliminates any concerns that a subjective test could impact the result. Better yet, the tests are sensitive enough to identify to species and subspecies levels. How can such precise identifications help you? Well, I’d like share a few times how it helped me in my career. 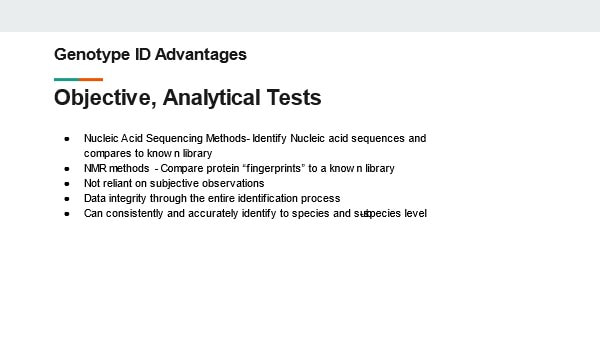 Slide 13: Example 1 In 2015 my laboratory was plagued by a Paenibacillus species. A few environmental monitoring and product test plates looked like this. The result was too numerous to count. We identified this organism to a species level and learned some really interesting things about how it grows. 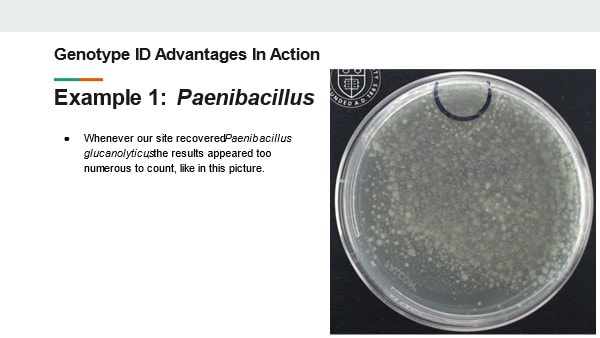 Slide 14: This video illustrates our findings. You should be able to see a small black circle on the top of the plate. An inoculum (a few CFUs) of Paenibacillus glucanolyticus was placed in that circle. As the video plays, you can see colonies pop up all over the plate. By identifying this organism down to the species level, we learned the most likely reason for the TNTC results wasn’t because we had mass contamination in our sample. We just had an organism that grows ... weird. This growth made 1 CFU appear as hundreds. This revelation was critical for us as we determined our investigation and response strategy. The TNTC results weren’t due to massive contamination of our product or environment. We were able to target our search for the organism in more nuanced locations. Best of all, we didn’t need to discard product or shut down the manufacturing line. Slide 15 Example 2: Another laboratory event from my past caused multiple tests to be contaminated with Bacillus Subtilis. This is one of the most common species that our lab recovered from around the facility. Locating the contamination’s source was going to be a nightmare! We collected multiple investigational swabs and found B. subtilis on lots of them. However, only one matched the strain identification from our original test samples - It came from the glove we used to remove items from the autoclave. Had we not had the strain identification, this is what would have happened:
With the genotype strain identification, we found the exact source of our problem. We changed our glove to one that was easier to clean. We never had the issue again. This saved us so much time and resources by minimizing repeat investigations and cleaning. 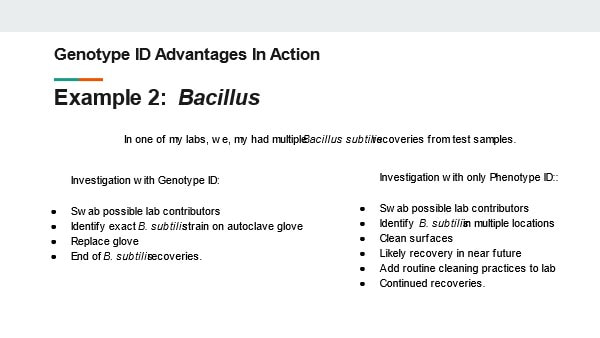 Slide 16: Example 3: A few years ago I worked at a biopharma manufacturer. The manufacturing rooms were kept cold (around 2-8C) to prevent protein de-naturing. This conveniently made it harder for microbes to reproduce in these rooms. That didn’t stop a Pseudomonas fluroescens species from contaminating our in-process product. Due to the organism being GNR and the amount of water used in the process, we believed the organism was coming from the water system. We were running extra, expensive, time consuming hot water sanitization cycles to flush this organism out. However, with a full genotype strain identification, we found the organism was a subspecies in the Pseudomonas fluorescens group called Pseudomonas antarctica. If you can’t tell from the name, this organism thrives in cold environments. This identification helped us re-focus our efforts on areas in the cold room where the organism could colonize. We ultimately matched the organism to the exact subspecies in a set of manufacturing hoses. 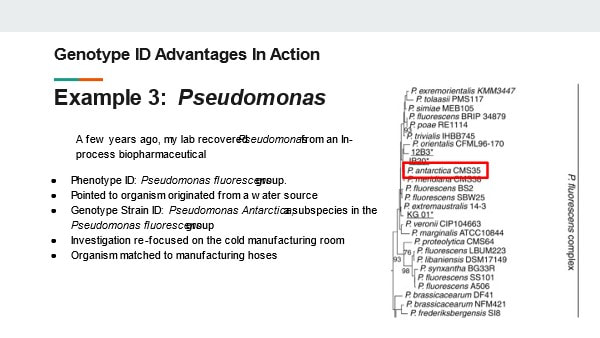 Slide 17: Those are only a few examples from my career where a good identification program changed the course of our investigation. As you can see, the investment saved us lots of time AND money. The genotype IDS saved us from:
Luckily, all of these sites were using (or transitioning to) genotype identifications during these events. They clearly reaped the benefits from this process.  Slide 18: But the original decision to implement the identification program was based on the trends of regulatory expectations for environmental monitoring programs. There are hints in regulatory guidance documents, warning letters, and other industry writings on the topic that agencies are expecting more from environmental monitoring programs than they have in the past. The EMA’s Annex 1 Expects all organisms recovered in grade A and B clean rooms to be identified to a species level. The FDA agrees in A 2004 guidance for sterile manufacturing . The FDA writing suggests the identification should be sensitive enough to match organisms if recovered in final product samples. The document goes so far as to call out the superiority of Genotypic methods over phenotype 8techniques: “Genotypic methods have been shown to be more accurate and precise than traditional biochemical and phenotypic techniques. These methods are especially valuable for investigations into failures (e.g., sterility test; media fill contamination). 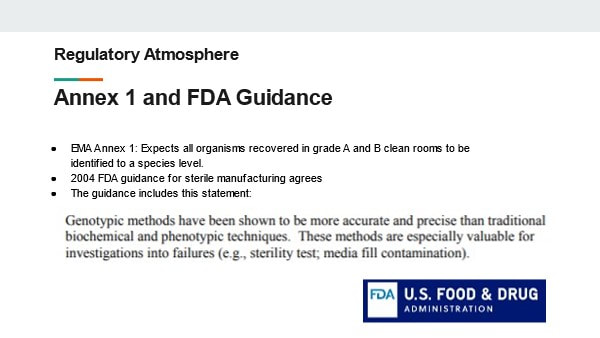 Slide 19: A few final notes from regulatory documents There are non-binding instructions to ID mycoplasmas to a species level In a 2010 FDA guidance for the Vaccine industry. There are similar strain typing suggestions to ensure contaminants aren’t originating from any biological sources. And these regulations aren’t just limited to the sterile industry. In food manufacturing, the FDA currently uses genotypic testing during site inspections when there are suspicions of food borne illness. Throughout all these industries data integrity concerns (similar to those with phenotype ID test methods) are becoming a more frequent target for FDA warning letters. As you can see, Having the capabilities to proactively perform genotype testing can save time and help with a decisions when facing a recall or other regulatory action. Having the capabilities to proactively perform genotype testing can save time and help with a decisions when facing a recall or other regulatory action.  Slide 20: The ultimate decision to invest in genotype testing can be difficult. There’s a comfort level in sticking with what you believe is already working. Hopefully you can fully appreciate all the ways that genotype testing can work better for you, your laboratory, and your customers. 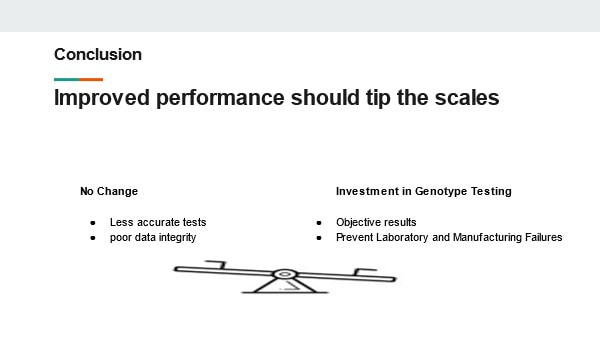 Slide 21 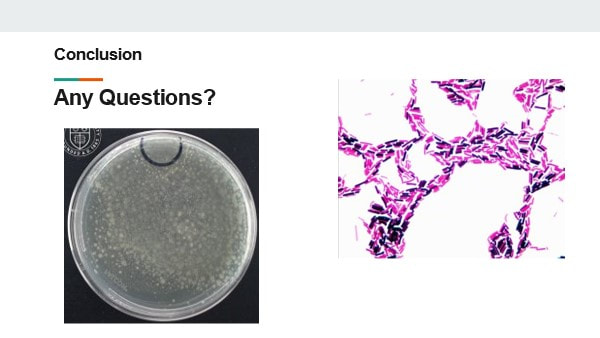 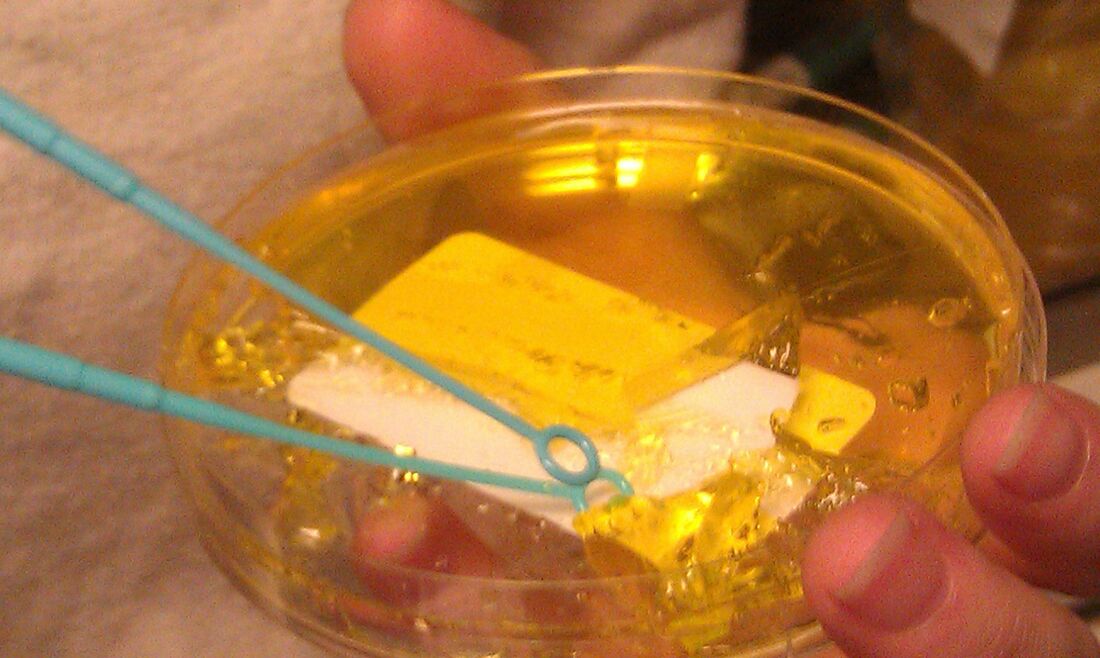 I’ve suffered through some nagging issues that don’t have a good answer. I'm making a few short posts to vent. Do these problems happen in every lab? Problem 1 – Fallgar In a Micro lab, it’s common practice to invert plates when incubating them. But why? Incubators are pretty humid. Condensation inside the petri dish pools on the media surface. Water causes colonies to spread out, making them impossible to count! If bacteria show up, you’ll never really know if it’s mass contamination or just one CFU that spread. For about six months straight, 1-2 times a month, the agar in one of our incubating plates fell into the lid. This would’ve been great if our agar was a Jell-o shot and we wanted to easily eat/drink it. Instead, we got non-hangover related headaches. Some pictures for context: This is what normal plates look like, before they're inverted, with media on the bottom of the plate:  Prior to incubation, we invert the plates: 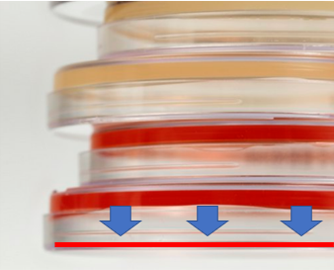 During incubation- the agar fell, as depicted by those beautiful arrows and red line. When we read results, the surface of the media where colonies grow was flat against the lid of the plate. Since the plate was inverted, the condensation droplets collected in the lid. Basically the agar fell into a mini pool of water.
There were so many questions from such a silly issue. They boiled down to these 2: 1. If microbes were on the media, would they have grown in this condition? What if there was a mass contamination event in a filling room that occurred right where this sample was collected, but due to the falling agar, we couldn’t recover any organisms? Organisms could have gotten into our sterile product and we never would have seen it. We did a quick study to look into this: Inoculate a bunch of plates with different organisms, cut around the edge of the agar, force the agar to fall into the lid, incubate, then see if final count matched our inoculation count. Luckily, the study supported we could recover organisms when this happened. Luckier yet, all the original plates with fallen agar had no growth, so we didn’t have to answer any awkward questions about whether the condensation messed with our counts (although we don’t know if water could have “drowned” anything there). 2. Why the hell was this happening? This occurred for multiple media lots over 6 months. We’d gotten our media from the same supplier for years. They made no changes to their formulation or plates. Our incubators remained the same, including all measurements like humidity and temperature. It happened to such a small percentage of total plates (about 1 in every few thousand) that the supplier didn’t consider it a major issue. Yet every time it happened, we had to open a quality record to investigate the root cause and impact. We never found a root cause, so we had no corrective action. This whole thing made me look like an idiot when it popped up as our most frequent type of event in our trend reports. How did we make it stop? We shut down the entire plant! There were other quality issues and remediation costs at the site, so the decision was made to close the plant. This media issue was nowhere close in severity to the other quality concerns. But had the plant not shut down, I have no idea how much longer this issue would have lasted. Have you ever seen something like this? If you want to know why I’m talking about bacteria in soap, check out Part 1 right here! This contaminated soap story starts with regulation to remove the antibiotic/preservative Triclosan from consumer products. Triclosan has some environmental risks and manufacturers couldn't prove Triclosan soap was any better than hand washing with regular soap & water. This ruling impacted the company I worked for. The company was awesome and changed their formulation years before the rule went effective. Unfortunately, Triclosan was hiding a contamination problem. The Triclosan was such an effective antibiotic the lab never found microbes in product that used it. When Triclosan was removed, low counts of Gram negative Rod (GNR) bacteria started showing up. If you’ve heard the phrase “the preservative system should not be used to address deficiencies in manufacturing processes” in a GMP industry, this is one reason why. Triclosan was hiding a major manufacturing deficiency. Bioburden action levels were conservative for a non-sterile product like this; the customer required an investigation for any GNR recovery. This caused major inventory back-ups. Soon after the preservative change, the company realized product piping was too wide to get turbulent flow during cleaning. They made some awesome investments in response to this finding, completely updating the piping. They even doubled the cleaning cycles for good measure. But the organisms kept showing up. The early investigations noticed a pattern. The system was designed to have product pump directly from the formulation tank to the filling line. However, during busy times, the site made product faster than they could fill it. Excess product was transferred to totes. The totes were manually connected to the filler lines when needed. The connection process took place near a drain in a non-ISO-classified warehouse setting. There was potential for operators to transfer organisms from wet surfaces to the tote connections with their gloved hands. This root cause made sense and aligned with most the data. The route of contamination provided little possibility of massively contaminating the batch, so the product wasn’t considered a risk to release. The tote staging process was improved. They also re-trained the operators on handling the totes. Still, the problem persisted. I was hired into the company to address it. My first observation about the cleaning and filling process: it was incredibly . . . wet. Considering how GNRs are commonly associated with water, that was a problem. I wasn’t too concerned with the environment around the tote set-up. I don’t usually buy that consistent recoveries of the same GNR organisms are tied to manual processes. What really concerned me was the steam generated during the hot rinse cycle during CIP. It looked like a cloud forming over the machine! I wanted to move our attention from tote staging back to the filler itself. I had luck figuring out this problem (not to mention avoiding the burnout of looking into it for a year without success). The luck started with some environmental monitoring data. Swab samples were collected from the line each month. The samples were collected immediately after cleaning, so we rarely saw any recoveries. Four of those samples were collected directly from filling nozzles. The second month I was at the site, we found the same GNR organisms on one of those nozzles. The totes are completely un-involved in the cleaning process. This gave us a concrete reason to look at something other than the messy-looking tote set-up. But what could we look at? We had a year of nozzle samples that never recovered these organisms before. I looked closer at the filler. Directly above the nozzles were plastic panels separating the filling area from a “dirty” mechanical space. There were 6 panels that could be removed for maintenance of the machine. The nozzle with the GNR recovery – it was directly under one of the seams where these panels came together. Lucky again- (and good system design)- the nozzles were numbered and we tracked the nozzles swabbed each month. Despite less than 40 total nozzles, we somehow went 7 months since the last time one of the six nozzles directly below a seam was sampled. That sample was the last time we had a nozzle recovery. It was gram positive, but it gave me something to go on. What was going on with those panels? I got permission to take them off and inspect. We noticed a lot of product residue back there. We attributed this to mishaps that routinely occur in the filler. When bottles jam in the machine, product splashes up and over the panels, landing in the mechanical space. The filler used to have a cover over this space, so we cleaned out the area and reassembled the panels with the cover. We even updated our swabbing procedure to ensure at least 2 nozzles beneath the seams were sampled each month. This was good progress that sort of explained the issue-
But the root cause wasn’t quite figured out. GNRs resurfaced a month later, so we checked behind the panels again. This time, there was only a small amount of product residue back there. Strangely enough, the residue matched the color of the impacted product lot that was made 5 days before we got the test results. But with the cover on, how’d the residue get there? It seemed the residue leaked from a specific piping connection in the mechanical space. That’s when the cause of our problem clicked. Now seems a good time for pictures. This rotary filler is like the one we used, although it doesn’t have the panels I described. In this picture, we’re looking down on the filler from above: 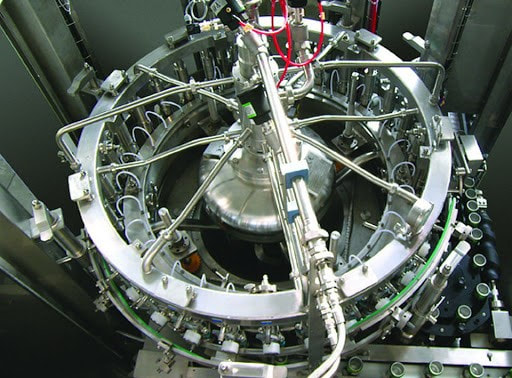 Bottles enter a rotary filler on a belt. The machine grabs them, fills them, and places them on an exit belt as it rotates. 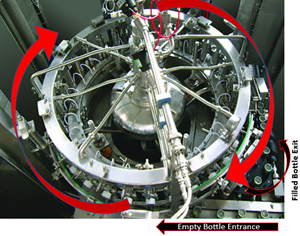 Product comes in from a central shaft. It splits into radial transfer lines and nozzles to fill directly into each bottle. 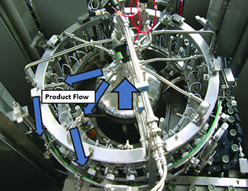 Piping connections are held together by a clamp/gasket combo. When the gaskets inside shift a tiny bit during cleaning, water leaks out. This water springs to life any GNRs in the mechanical space. As the filler runs, the centrifugal force pulls the water to the outside, allowing it to drip down the nozzles into the bottles. This water brings all the bacteria and dust bunnies it can carry. 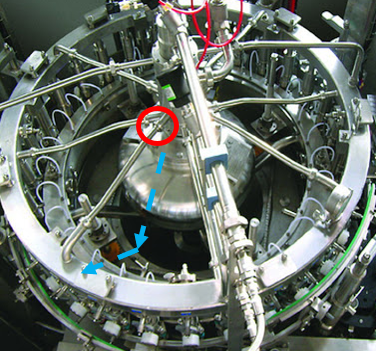 Our immediate corrective action here- we changed our gasket maintenance from yearly to quarterly. Product hits went way down. But we didn’t eliminate them.
I wasn’t with this company for long (I wanted to return to Pharma) so I didn’t get to see our long term corrective actions carried out. One thing they could have done is use high pressure clamps at those connections. But the corrective action that interested me- revalidating the CIP to remove half the cleaning cycles. We had micro hits and we wanted to REDUCE cleaning?!? Seems counter intuitive. But check it out:
There are 3 points I want to get across from this post-
Have you solved my riddle yet? What vegetable is bad for manufacturing equipment? A leek! 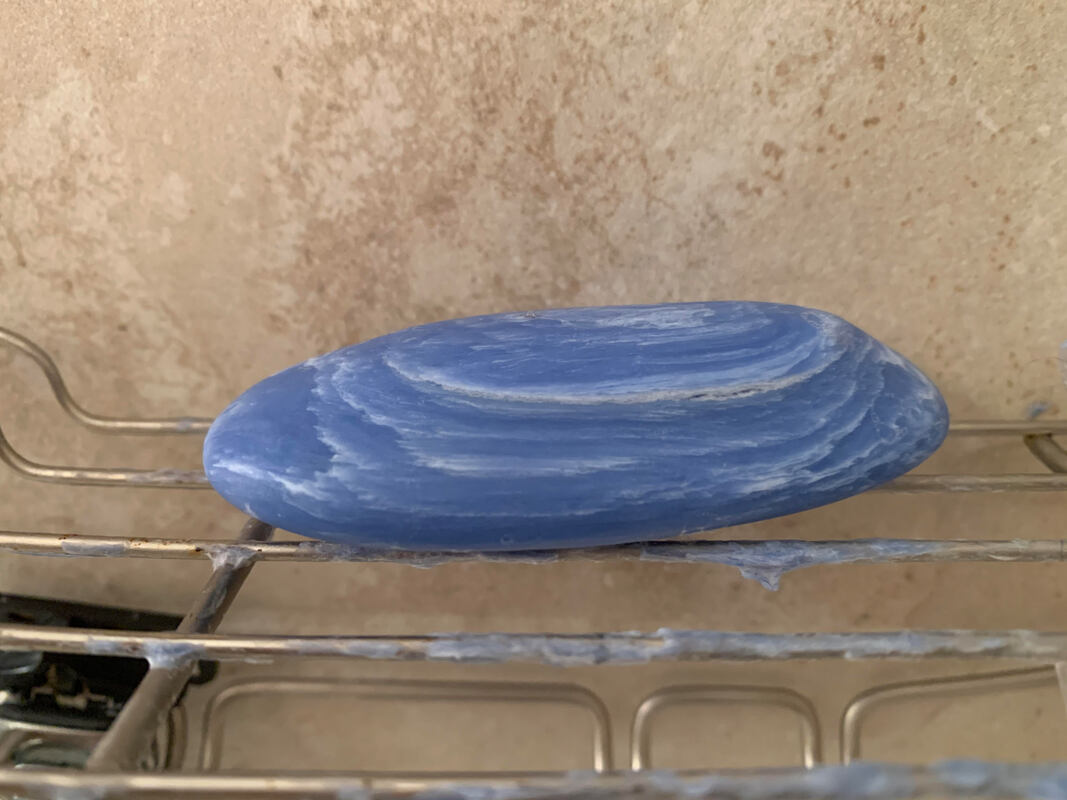 In the 1960’s, a NICU unit ran out of their standard issue hand soap. Nurses and staff brought their own soaps from home. Bad move. One of the soaps was contaminated. The nurses used it right before handling the newborns. You can guess what happened next. I’m guessing too, because I can’t find the source of this story anymore. Maybe this is it, but that story’s about hand lotion, and it’s not even a neonatal unit. This one is a neonatal unit, but much more recent than I remembered. And the soap came from a re-fillable dispenser (it wasn’t manufacturing contamination). Those dispensers have their own issues, but not nearly frequent enough to outweigh washing your hands. Why write about soap? I used to be a Senior Microbiologist / Plant Hygienist at a soap company. No, I wasn’t the cool research scientist discovering new ways to kill bacteria. I was there to make sure bacteria weren’t in the soap we made. I want to write about a contamination event that happened at this soap company. I was hired to address this contamination. When I started, I introduced myself to everyone with a little presentation. I gave my background and went over the importance of making clean soap. Coming from a sterile injectables background, I didn’t know where to start with that second part. So, I looked to some Friends: Once I hooked ‘em with laughter, I wanted to hit ‘em with the impact of real-life soap-contamination. That’s when I whipped out the sick babies. I swear I had a source back then! It had pictures I used in that presentation. Unfortunately, now the internet only wants to tell me about Covid anytime I search for “infection”, “soap” or “hand washing”.
But the impact of contamination is rarely the microbes involved. Before I started at the soap company, they justified releasing their products because the counts were low and the product wasn’t intended to be sterile. That decision changed when we eventually found the root cause. I learned a good lesson from this investigation. I took it with me when I went back into pharma, where microbes are usually only seen in early processing steps. They get filtered out before the product is filled. But what else sticks around in the product? In both those scenarios, management looked at the contamination as if the bacteria floated in as pure individual cells. I learned that’s rarely the case. This post is part 1 of a 3-part series. In the next couple parts, I’m going to dig into the soap and the pharma issues where the bacterial contamination was just a symptom of the real problem. Stick around if you want to hear what’s getting into your soap AND your drugs! Part 2 is right here! Particle counts were off the chart in an ISO 8 clean room! Literally, the particle counter couldn’t count high enough. A pump was spewing oil with each thrust. The spewing started slowly after a routine maintenance activity. Counts built up slowly over months then exploded into OOS results, forcing us to act. We fixed the pump and everything was fine again. Let's talk about the last step of that investigation. We needed to complete an effectiveness check to close the record in our quality system. We need to be “SMART” with our effectiveness checks! These principles were referenced in so many trainings I’ve been through. SOPs required this “SMART” plan. This is how the effectiveness check for the pump fix was SMART: Specific - We had a particle excursion in a specific room, so we assessed results from that room. Pretty specific. Measurable- We measured using the routine test procedure and compared measurements to our SOP/ISO 8 requirements. Achievable- All results had to pass. We knew it was achievable because the room met requirements when the pump was working before the break. Relevant- The rationale here was covered with “Specific”. If you had a particle failure, and you wanted to make sure that failure wasn’t ongoing, then you want to know results are good after the fix, right? Timely- Per procedure, we couldn’t keep effectiveness checks open for longer than 3 months. That guaranteed us 3 post-fix results with our routine monitoring plan. Perfect. The plan seems logical right? Unfortunately, every aspect was misguided. In an effort to make the effectiveness check achievable and timely (make it pass, fast!) the plan was designed like too many other poorly designed effectiveness checks. "Look at the same test results for X amount of time." The corrective action is effective if everything passes. First- The root cause wasn’t the broken pump, it was the yearly maintenance that broke the pump. Our post-fix tests showed we fixed it. We had no idea if the next maintenance would break it again. Second- We needed to know if the new maintenance procedure was effective. Since the maintenance was done on a yearly basis and our effectiveness checks were not allowed to be longer than 3 months, the “T” part of the “SMART” effectiveness check was impossible. To avoid keeping the record open for a year, we emphasized the broken pump as the root cause. That way, the effectiveness check just needed to confirm we fixed the pump. Isn’t that crazy? We feared an effectiveness check requirement, so we changed the root cause. That could have impacted what we did to correct it. If I hadn’t pushed the maintenance group to update their procedure outside of the investigation record, we wouldn’t have had a maintenance fix at all. This was one of many experiences that made me HATE effectiveness checks. But they need to be done. How else can we show our corrective actions are effective? Well, let’s see what they FDA has to say. Surely they have some recommendations. The FDA defines effectiveness checks in their regulatory procedural manual. “'Effectiveness Checks' are actions taken to verify that all …." Don’t waste your time with the whole definition. It only speaks to recall actions. It has nothing to do with corrective actions for GxP issues. CFR 21 part 820 also speaks a little to corrective action effectiveness. Manufacturers must have procedures for “Verifying or validating the corrective and preventive action to ensure that such action is effective and does not adversely affect the finished device" That’s the extent of it. No hints on HOW to do the effectiveness check. What about FDA warning letters? The FDA demands actions from countless firms that need to fix quality issues. I checked through a bunch of warning letters. It's always similar wording, something along the lines of: “You should address how you plan to oversee your CAPA program to ensure that you are confident that all corrective actions taken by your firm are verified to be effective.“ The FDA keeps making demands with no guidance on how to meet them! Well, they do make suggestions to bring in quality consultants. Those experts love the SMART plan. The particle example shows how, when that plan is taken out of a vacuum and mixed with mixed with metrics and business interests, you get some misguided and superficial effectiveness checks. So what are we supposed to do? Well, what if we look at it a different way. How does the FDA train themselves to see if a firms’ corrective actions are effective? Following that train of thought, I found a presentation on the FDA’s website for their inspectors. This is the most exhaustive section I can find on effectiveness checks: "Determine if corrective and preventive actions were effective and verified or validated prior to implementation. Confirm that corrective and preventive actions do not adversely affect the finished device…" Ok, on par with other FDA documents. Make sure the cure isn't worse than the disease. What else? “Using the selected sample of significant corrective and preventive actions, determine the effectiveness of these corrective or preventive actions.” Getting repetitive, determine if changes were effective, but go on… “This can be accomplished by reviewing product and quality problem trend results. Determine if there are any similar product or quality problems after the implementation of the corrective or preventive actions." Finally! Something substantial to determine if a corrective action is effective. It makes perfect sense. You can tell if your corrective action was effective by comparing trends of the problem before and after the action was complete. Firms should already have routine trend monitoring for potential quality problems. That’s where corrective action effectiveness should be tracked. Trends can be annotated at the event and expected change point with the event and corrective action. 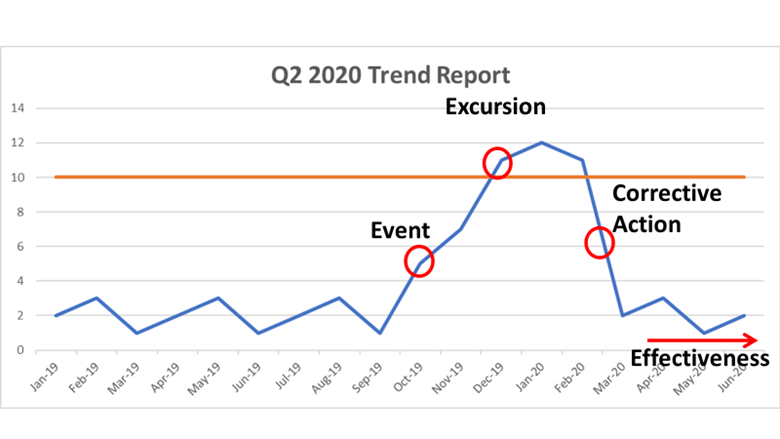 Firms feel obligated to keep quality records open until individual effectiveness checks are complete. That's a big time drain and shortsighted. Trend programs, which can cover years of product and environmental data (including other non-conformance trends) should include references to relevant excursions and events. Write your trending procedures to track data associated with those events. That way, you’ll never need to keep quality records open for effectiveness checks again.
This is a boring subject that I could talk about for hours. I have some more examples I want to add to this, but I’ll save that for another day. Also- It’s exhausting digging up all the FDA’s thoughts on this issue. Let me know if the FDA or other regulatory agencies have other documents that address effectiveness checks. I’d love more background! Part 1 of this series discussed endotoxin contamination in a WFI system. During the investigation, we noticed something strange in our historical data review. A couple city water samples didn’t have their expected endotoxin. Part 2 of this series looked into raw data for those tests. For one of those two tests, endotoxin levels were just below the limit of detection threshold. That made sense. I ended part 2 saying “I saw _______ ”. I wasn’t leaving you with a blank to fill in. I literally saw a flat line. What’s so interesting about a flat line? Quick recap- The lysate we used for testing (i.e. purified horseshoe crab blood), turns yellow over time. It turns yellow faster when combined with endotoxin. The test measures how fast samples turn yellow by collecting yellow intensity readings every couple minutes. After most tests, the raw data graphs look like this: 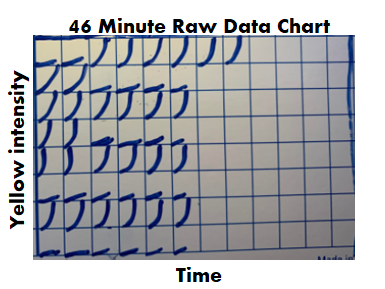 Part 2 really goes into detail on this, but the squares are graphs representing each well of a 96 well plate. The right half of the plate didn’t have anything in the wells, so the raw data graphs look like empty boxes. They're actually flat lines running along the x-axis. The raw data for the 2nd atypical city water day looked like this: 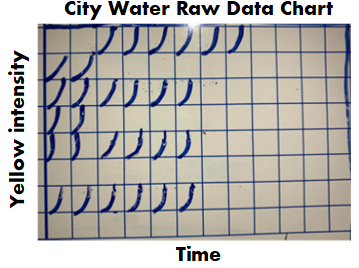 Tests wells with lysate, but no endotoxin, should have graphs like this:  For the test in question, the graphs looked like lysate was never added to them, like this:  Part 3 of this endotoxin series starts here. We found a single assay that looked like lysate wasn’t added to test and negative control wells. If that was truly the case, the samples were never tested, but the assay was guaranteed to have all results meet specification. The official test report can't detect this error.
So what do we do next? A bunch of things simultaneously. Identify our scope. It would’ve been easy to write this off completely. The raw data wasn’t used for any official purpose. We even reached out to the equipment supplier and they couldn’t support any conclusions from the raw data. According to them, if all parameters in the final report met requirements, the assay was acceptable. It also would’ve been easy to call this a one-off assay with (potentially) invalid results. We could have written up a low-impact non-conformance report and called it a day. But I’m proud my company supported the search for, and reporting of, everything impacted by this issue. Further review determined a single analyst was responsible for 3 months of assays with this pattern. We immediately considered them all invalid. Lysate was not used in the test wells of:
Damage Control The clock was ticking. Per 21 CFR 314.81(b)(1), the site was required to submit a Field Alert Report (FAR) to the FDA within 3 days. We had information concerning significant quality problems with distributed drug product. We had dozens of lots on the market without a valid, required relase test. To make matters worse, this site received a warning letter for endotoxin issues less than a decade prior to this event. It was all hands on deck in the endotoxin lab. We had 3 days to generate valid tests for all impacted lots. We tested retains for all of them. We barely had enough test equipment to complete all samples that quickly, but we somehow got it done. A non-conformance event was opened to address the impact of the water sampling that couldn’t be replicated. We also had to re-do equipment validations. We got through it, and I feel as confident as I can be in the quality decisions that were made during this time. Handle a Human Resources Nightmare. Officially, the analyst consistently repeated an error in their technique. This error somehow developed after months of testing correctly. The analyst added lysate to standard and positive controls wells first. These wells are supposed to have endotoxin - they require a lysate reaction for the final report. The analyst claimed adding lysate to these wells first helped prevent contamination (that in itself is faulty logic). Then, the analyst “forgot” to add lysate to the test wells. There were other raw data inconsistencies that contradict the official story. A variety of different colored products were tested over these three months. These products all have different “baselines” - the first reading when the equipment starts measuring yellow intensity of the sample. However, in assays where the analyst claimed to test these products, the baseline readings for the sample positive controls (where we know lysate was added) were the same as the baselines for water positive controls. The baseline should have been much higher for a colored product. To me- that meant the analyst never even attempted to test the product. I dug into all assays this analyst performed. I also checked on multiple assays performed by other testers to confirm this wasn’t a department wide issue. I came to the following conclusion: The analyst knowingly tried to cheat the test to prevent “complications”
I wasn’t involved in the HR and management discussions. I believe they agreed with my conclusions, but they officially aligned with the analysts’ explanation of events. I think they were stuck:
Prevent this from ever happening again. We made raw data review an official process moving forward. Every analyst was trained on what to look for when performing and reviewing assays. There were strange nuances though. For example, if a bubble formed during pipetting, it could impact the baseline reading and cause a flat line graph. There were ways to tell if that was the case, but impossible to define in an SOP. Clearly the analyst never should have made this error. I think the stress of the job contributed to it. The job occurred on 2nd shift. This shift was understaffed and often dealt with time sensitive samples. The samples could come at any time during the shift. A minor issue with an assay at the end of the shift could require the analyst to work unpaid (salaried) overtime through the night. There was no 3rd shift in the lab to help on those late nights. The temptation to cut corners proved too much. Soon after this event, a full-time 3rd shift position was created. It was extremely comforting knowing critical samples could be handled as a team. It removed a lot of the corner-cutting temptation and significantly reduced the stress on the job in general. This was such a strange event it never would've repeated regardless of the actions we took. But the Lab became a better place because of those actions. |
