|
Welcome back to the final segment of this series! You can catch up on Part 1, Part 2, Part 3, and Part 4 <-- right there! To sum up all 4 of those parts- We solved a Bioburden problem! Product contact piping wasn’t getting cleaned between runs. It seems so easy in hindsight. All we had to do was adjust the cleaning cycle. How could we mess that up? That’s exactly what I’ll go into in this final part of the series. We went a year before finding our biggest mistake. I was instructed to close the investigation when we figured out the bacteria’s source. Then, engineering opened a second investigation to document why the piping wasn’t getting cleaned. Their corrective action plan wasn’t too complicated. They updated cleaning cycles to:
So what happened a year later? We got another bioburden OOL at the same manufacturing step. This time it was a hodge-podge of gram-negative water organisms. Mostly Stenotrophomonas. The old gang got back together to look it over. Site management followed this one even closer, knowing we were now delaying active commercial runs. The Engineering manager confirmed CIPs were performed before the run. The team had another equipment inspection and swabbing party. We found lots of gaskets in poor condition, so we replaced them and scheduled a contract cleaner again. This was major déjà vu, so I reached out to the engineering techs. I wanted to learn more about the cleaning programming. Our talk was all we needed to find the new root cause. For the entire year, the site was only using one of the pooling vessels. A few runs before this OOL result, the qualification for the second pooling vessel was complete, so it started to get used. Although the operators could now choose the appropriate CIP inlet, there was no procedure to prompt operators on which one to use. The CIP cycle continued to run through the same inlet. When the 2nd pooling vessel was used, the same section of piping wasn’t getting cleaned (circled in red below). 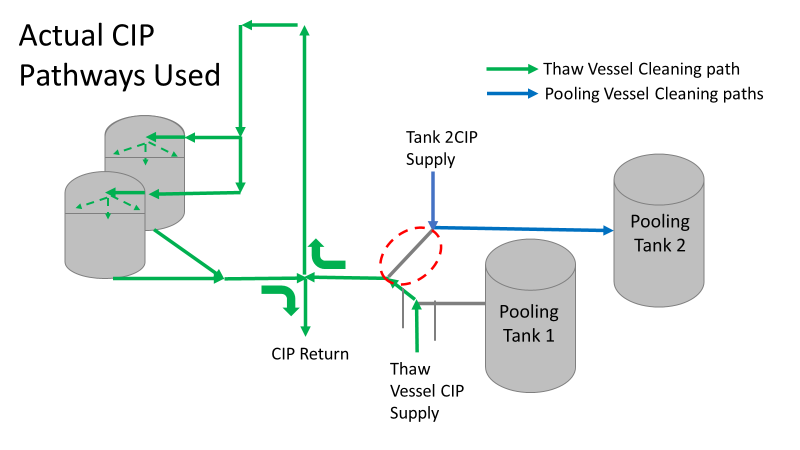 This was also fixable! The operating system required a cleaning cycle to be performed before a tank could be used. We designated that circled section of piping to register like a tank. The system would electronically “block” that section from being used if it wasn’t cleaned. We would never have this problem again! This problem would have easily been identified had we walked through the process from an operator’s perspective the first time we “solved” the bioburden issue. But there were other system problems that should have been solved with the first investigation. Quality improvements are normally seen as extra costs and delays. But these quality improvements can go hand in hand with manufacturing efficiencies. I have two examples from this critical investigation. Manufacturing efficiency example 1: Operators were frustrated with cleaning delays. They couldn’t clean tank 1 while the system was running to tank 2 (and vice versa). This didn’t make sense. The equipment was designed to allow for that. There were multiple block valves between the CIP inlets and the opposing product lines. 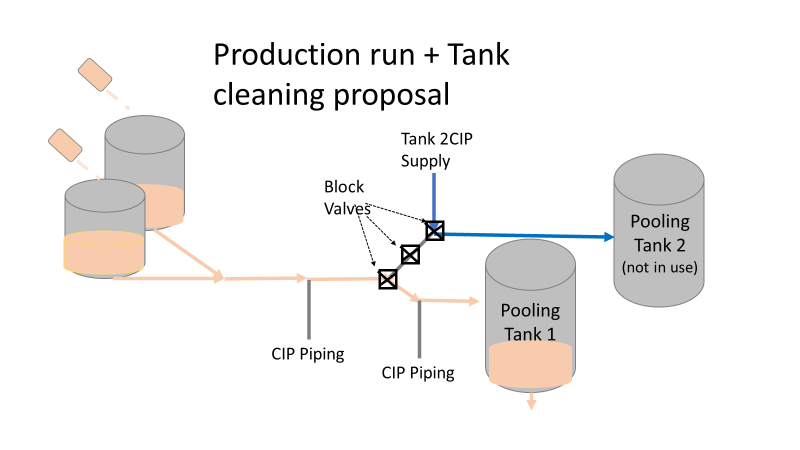 This problem became my green belt project. I left the company before the change was completed, but we had a plan in place when I left. In the scenario above, the production run “owned” those 3 valves. This prevented any other cycle that could use those valves from starting. All we needed to do was update ownership of the valves in those cycles, and we could save the production team 3 HOURS between each run. This was huge for a site planning to increase from 10 to 14 runs per week. With the experienced group of engineers working on the bioburden issue, this delay could have easily been fixed during the initial investigation. This was another example of not looking at the system through the lens of the people using it. Manufacturing Efficiency Example 2. I discussed in the earlier parts of this investigation that the microbiologists were pre-occupied with the bottle transfer process. The bottle rinsing chamber caught their eyes. The rinse chambers had open-able windows lined with gaskets. During the investigation, the gaskets were removed to swab their housing. The swabs were covered in black residue. There were no bacteria in any of these samples. However, the residue was so concerning that we made a major update to the chamber cleaning process. The new SOP required gaskets to be removed, cleaned, and placed back into position between each run. This added a huge extra delay to the cleaning process. There were 12 gaskets. It took a half hour to clean them all. 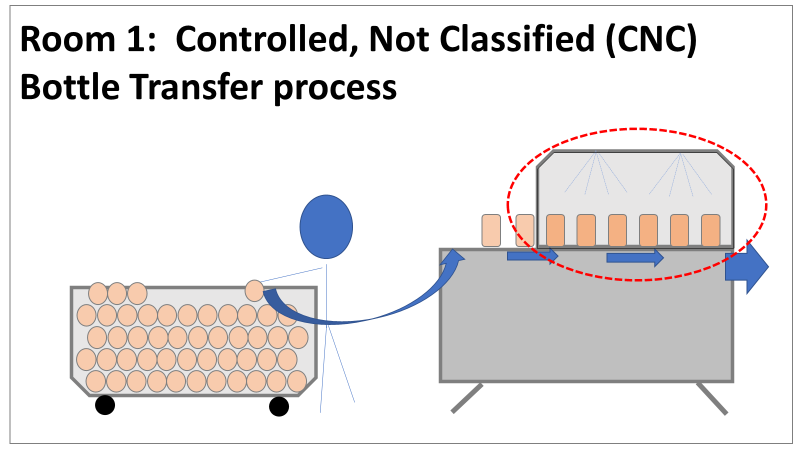 The extra quality problem the cleaning caused was even worse.
The gaskets’ integrity deteriorated between each manipulation. Over time, they stopped forming a good seal. There were even times where operators replaced them backwards (this was very easy to do). This led to major leaks during runs, flooding the bottle transfer rooms. The initial investigation team added a time-consuming process that wore down equipment and caused leaks in the manufacturing area. The team was grasping at straws for a root cause. They pushed the change to feel like they were doing something to make the system cleaner each run. If you read (red/reed) part 3 of this series, you’ll see why they never should have considered that area as a source. Cleaning the gasket housing as part of the routine equipment PM would have been sufficient to address the residue issue. I created the SOP redline for the process owners to remove the gasket cleaning process. It was never given priority (likely because the process was stopped without changing the procedure). The site probably still has the cleaning instructions in their procedure. There are other compliance issues if an effective SOP is not being followed. The major take away from the last part of this series- walk through your processes from the point of view of your operators. This is text-book poka yoke. Poka yoke is often taught in a quality/error-proofing context. But when you’re given this opportunity to look for production improvements, use it! P.S.- Blaming gaskets for a micro issue is lazy. You can look at any piping system (with or without bioburden issues) and find gaskets in poor condition. Finding them doesn’t mean they’re the cause of the issue.
0 Comments
Welcome to the 4th part of this Bioburden contamination Investigation! Part 1, Part 2, and Part 3 emphasized this investigation’s importance, what was going wrong, and how we should have thought about the problem. I haven’t been too clear on order of events, so let’s catch up on that. The site ran 3 Engineering runs without contamination. Run 4 was overgrown with Bioburden (Bacillus). The investigation blamed the use of a pool skimmer in the pooling vessel. Run 5 was also overgrown with Bacillus. During this month-long investigation:
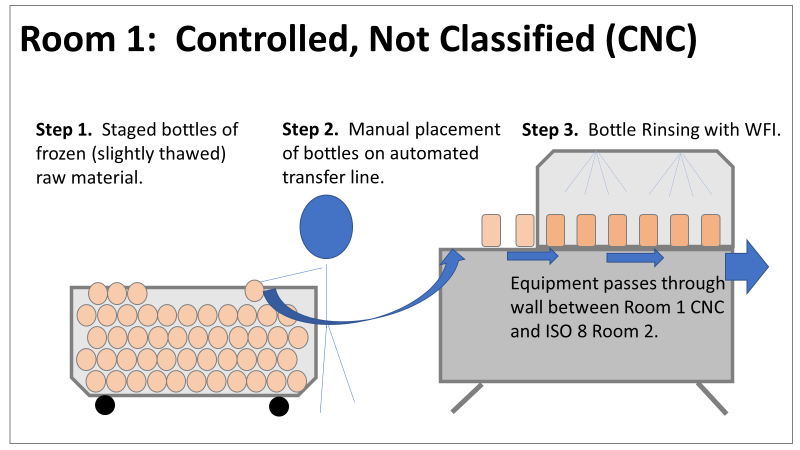
Commercial Runs 1 and 2 ran back to back within a week. Run 1 had elevated Bacillus recovery, but below the established limit. Run 2 was OOL. New SMEs were brought in from sister sites. More swabbing was performed, and the team spent more time looking into bottle prep activities as the organism’s source. Another contractor cleaning was planned before run 3. The team was running out of clues but needed to wrap up the investigation. We didn’t have a choice; we would close the investigation and blame our best guess by run 3's planned start date. Less than a week before the investigation due date, the team was ranking which part of the bottle prep process was the most likely culprit. My mind was wandering to the cleaning validation results. Rinse samples were collected from most of the the pre-run equipment cleanings as part of the Clean-In-Place (CIP) validation. A few had Bacillus recoveries. Validation and Engineering were happy with the results because they met requirements. But of all the investigational tests performed, these ones hinted the organism was in the equipment in its cleanest state. The Engineering and Validation groups gave a presentation on the equipment and CIP process early in the investigation. The investigation team (including me) were out of our element for this. The engineering diagrams looked like an old school Windows screen saver to me.  We trusted the presentation. It made sense cleaning was performed correctly. When we looked at the actual equipment it looked simple enough, like the diagram below. Product went in one direction from the thaw vessels to the pooling vessels. Product contact piping is highlighted in pink. 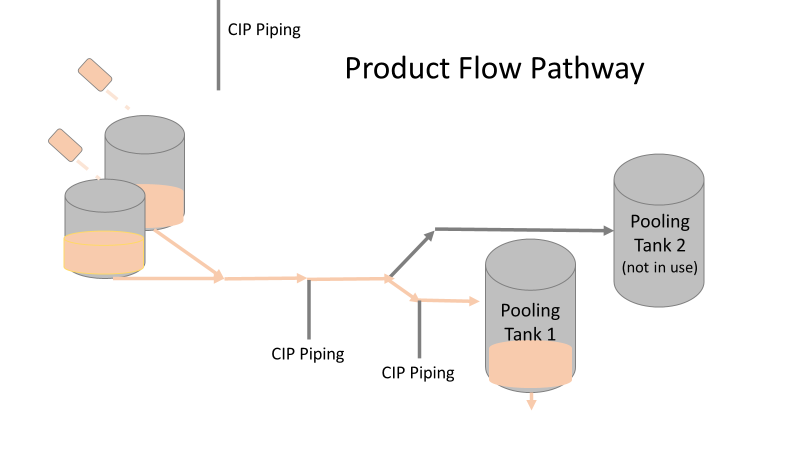 The cleaning process seemed just as simple. We saw where the CIP piping was connected to the thaw and pooling vessels. We also knew the thaw and pooling vessels couldn't be cleaned at the same time due to pathway overlap, So the team walked out of the presentation understanding the CIP paths looked like this: 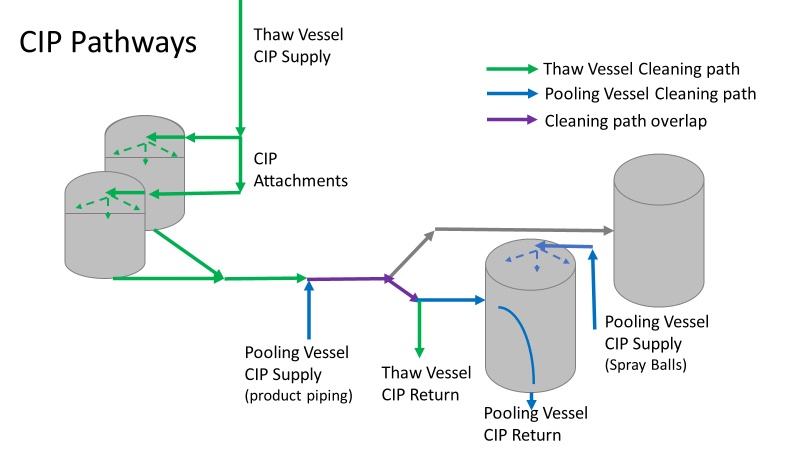 I spent a lot of time walking the product pathway in the mechanical areas. There were some valves and pipes that didn’t make sense to me. You can see those pipes circled below: 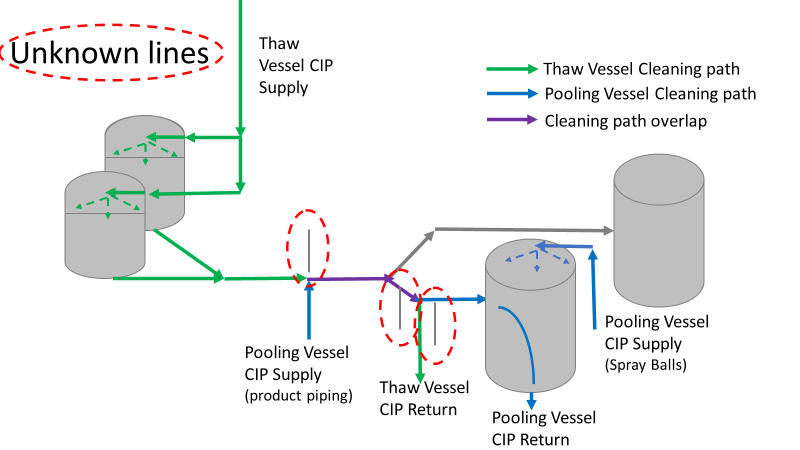 It bothered me not knowing what those pipes did. I asked the engineers. They didn’t seem concerned. They were CIP and drain pipes. This late in the investigation, I couldn't get a chance to talk out how they fit in the system. To help learn their fit- I pushed for a better rinse test than CIP samples. I was able to convince my manager to do exactly that test by talking him through the next diagram. CIP samples aren’t representative of every product contact piping section. It’s impossible to clean a tank by sending cleaning agents through the product inlet. To clean the tank, we use spray balls inside the tank lid. One CIP cycle runs through the product inlet, and a separate cycle runs through the tank spray balls. Rinse samples are collected from water that went through the spray ball pathway. These samples represent the cleanliness of the tank, the biggest product contact area. That means the test doesn’t tell us about the condition of the product inlet (circled in red below) 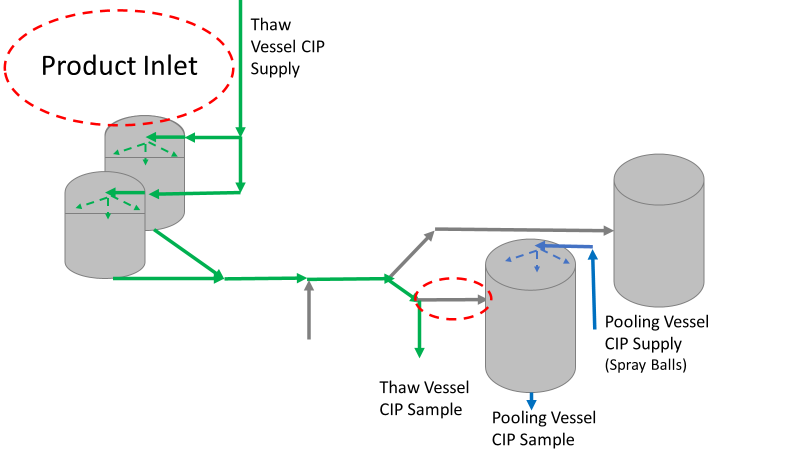 My manager presented the test idea to site leadership (I’m still a little salty I wasn’t given credit). After run 3, the equipment was CIP’d and rinse samples were collected from the green and blue paths above. We then altered the valve sequencing to send water through the green path below. 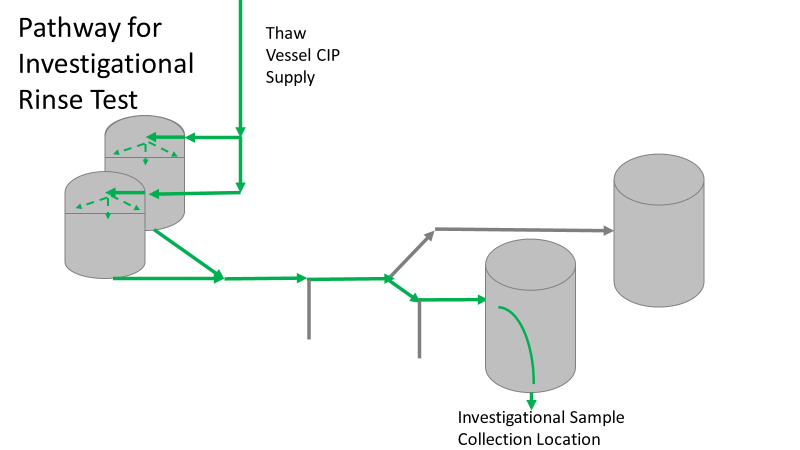 Run 3 bioburden results and the routine CIP rinse samples came back great. Site management started prepping raw material for run 4 thinking the investigation team figured it out. The investigational rinse samples were collected late enough that they were tested a day later. We convinced the production team to hold off starting run 4 until these results were ready. We were glad they did! These plates came back COVERED in Bacillus! They had to delay the start of run 4. So what happened? The results forced the engineering team into overdrive figuring this out. We were confident the product inlet section I circled was getting clean- we could tell water and cleaning agents were entering the tank through that inlet during the CIP cycle. As we looked further into the equipment I learned how the CIP actually worked. The thaw and pooling vessels had the same CIP source. To clean the thaw vessels, water flowed upstream from an entrance near the pooling vessel, diverted to non-product contact piping, then came back into the product pathway at the thaw vessel lid. 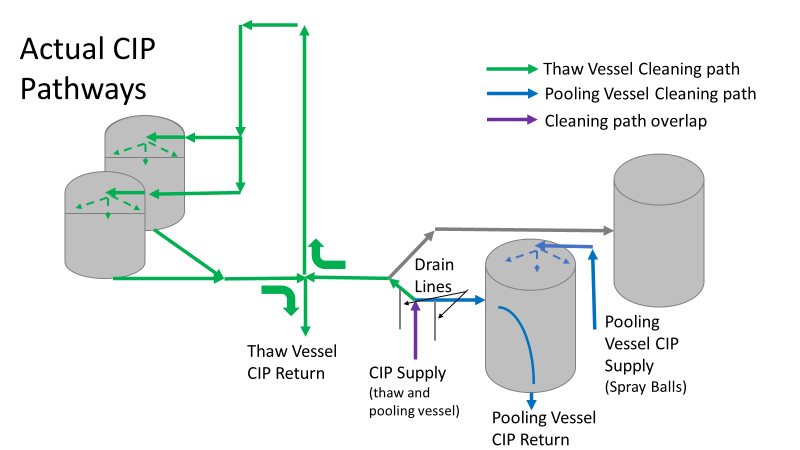 This was great! Well, not so great. This explains how a source of contamination in downstream pipes (where we had overgrown swabs) could spread to the top of the line. It also made us realize a mistake when we set up the system. There was a plan in place for scheduling the pooling vessels when the site was designed. Each pooling vessel would only receive raw material from a dedicated set of thaw vessels. The cleaning pathways were set up according to this plan. As a result, when the second set was used for the tank they weren’t dedicated to, a significant portion of the piping wasn’t getting cleaned. Broth residue remained in this spot between runs, growing the billions of bacteria needed for such huge bioburden recoveries. That section is circled in red here: 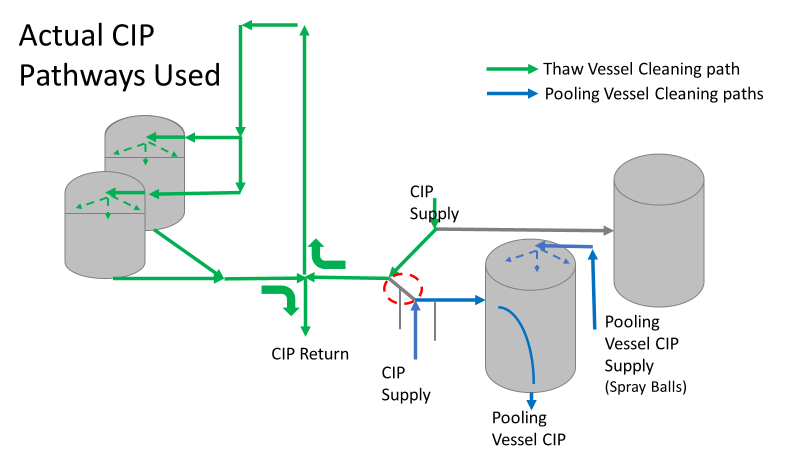 That still leaves a couple major questions.
1. How did the results meet requirements for run 3? The engineering team thought the contractor was using a better chemical to kill this spore-forming Bacilli. However, the contract cleaner couldn’t use the same CIP inlets for their cleaning agent. So, they had to manually adjust valves similar to how we ran the investigational testing. This allowed the contactor to clean all product contact piping. The cleaning process wasn’t as effective prior to commercial run 1 because there was so much time for the drain piping issue to impact the run… 2. What’s the drain piping issue, and why was Bacillus in the first set of thaw vessels? Drain valves throughout the line are opened after each product run and CIP. These openings allow residual broth to enter the drain line. There was no cleaning cycle to remove this broth from the drains. The drains pictured above lead to an ISO 8 space with high air pressure. Now imagine the draining process like you’re emptying a 2L soda bottle. Air gurgles into the bottle to replace the liquid. After the CIP, high pressure air pushes through the drain back into the product line, carrying any bacteria in the broth residue along the way. Now we have our two root causes:
We had to reject $2 million worth of raw material from commercial runs 1 and 2 to figure that out. Luckily, the last-minute test added between runs 3 and 4 saved the next million dollar batch. To correct these issues, all we did was alter the CIP cycles to clean the implicated areas. In part 5, I’ll show how we failed on the follow through. I'm proud of this video I made about a seemingly minor investigation. I was disappointed by how glitchy the recording came out. Either way, the story emphasizes the need to look beyond human error, so I hope you find it interesting. If the glitches are too much, I posted the script I used below. Slide 1:
Hi everyone! We’re doing my 6th gripe – Manpower. Part 2. This is a real example I encountered in a previous job. I’m excited to try some animation software. Slide 2: Stop me if you’ve heard this one before. A microbiologist walks into a lab with some test samples Slide 3: She checks the labels and her SOP to know the right test methods Slide 4: She documents what she’s testing on her paperwork Slide 5: Then she safely completes her tests for the day. Slide 6: 3-5 days later, she reads results… Slide 7: …and turns in her paperwork for review Slide 8: But the Supervisor notices something wrong! The microbiologist documented a product test, but the lot number was for media. This means the sample was tested per the wrong method! Slide 9: The supervisor and Lab manager conclude this is an obvious human error. The Microbiologist had a media sample. There were clear directions in the SOP for testing a media sample, but she tested it per a product method. She begrudgingly admitted she made an error, so they pulled me in to write this up in the deviation report. Look at me there, so smug. (PAUSE!!!) In the grand scheme of things, there was little impact with this event, so I was to close this investigation quickly to keep the deviation closure metrics looking good. It should be easy, right? the root cause was already known (manpower – human error), and the tester admitted to it. (PLAY!!!) Slide 10: If you saw my last video, you know I don’t buy into manpower root causes too easily. So I talked to the analyst to understand how she tests. Wasn’t there something suspicious earlier? Slide 11: The sample label said to test per the product method! As there are no other spots on the label with the product name, the testers always look to that test method line for sample identity. (PAUSE!!!) This wasn’t obvious to confirm- Sample containers are routinely destroyed with their labels during testing. It took a lot of digging in the label generation system to find out what the label looked like when she received it. Slide 12: I pushed against the manpower root cause. The analyst tested the way the GMP label told her to test. Slide 13: Management pushed back with a bunch of reasons this was the tester’s fault.
Slide 13: I need to take a break from animations to show context of those arguments:
Slide 15: I worked with the labeling system administrator while the root cause assignment sorted itself out. Since the media was for production study, test samples were labeled to mimic the product, including the label’s method. All future media tests were also set up this way. All we had to do was make a simple change in the system to label future media samples with the media method. Slide 16: I understand blaming manpower is tempting here. But had we blamed manpower when management wanted me to, the ONLY benefit would have been a short-sighted check mark on the investigation closure metric. Slide 17: By looking at the system from the Microbiolgist’s point of view, we made simple, meaningful change to prevent this issue in the future. Sure,
That doesn’t mean human error was the root cause. Those factors pale in comparison to the fact that the GMP label told her it was the wrong sample. We just needed to dig for this real root cause. Thanks again everyone for watching- I hope you liked it! Welcome back to part 3 of this investigation series. I don’t know how to select the picture that pops up when I post an article. It always shows the first picture in the article. So here’s a Bacillus Bunny. I’ll get to how it’s relevant by the end. 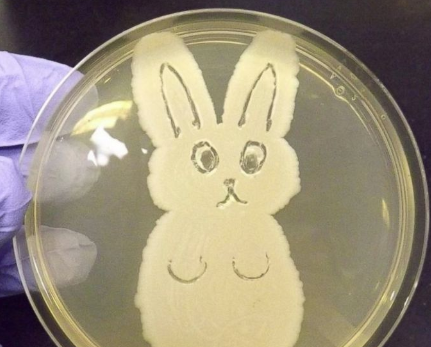 Part 1 of this series presented the bioburden issue. Part 2 discussed the team we put together and our initial findings. In part 3, I want to go over what our team did. During the equipment swabbing party, the team noticed multiple gaskets in poor condition. These gaskets were viewed as one source for harboring the organism, allowing it to proliferate between and during each run. The engineering specialists focused on remediating that issue short term (gasket replacements) and long term (better preventative maintenance). They even brought in an outside contractor to run a special cleaning agent through the lines after all this maintenance was performed. This was all done between the last engineering run and the first commercial run. Despite these gasket issues-
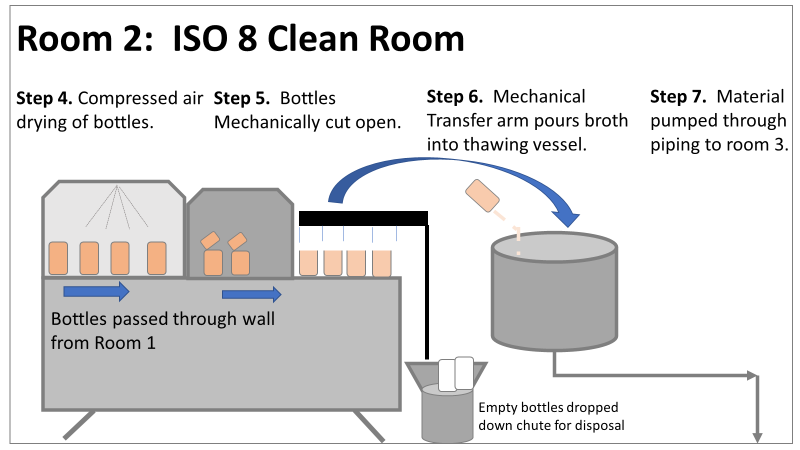
Therefore, most investigation time focused on the organism’s source: either room 1 in the CNC or room 2 in the ISO 8 area. As a reminder, this is what those rooms looked like.
This investigation got the attention and resources of a final product sterility failure. Since the source of the organism was unknown, it was also investigated like a sterility failure. The micro experts were VERY good at pointing out non-sterile aspects of Rooms 1 and 2. That was evident during the brainstorming session of the Analyze phase of the investigation. The team spent a month performing the investigation this way. We swabbed all over these rooms and never found the same organism. Recovery of any Bacillus species were rare. We collected water samples directly from the conveyor belt rinsing station. We pored over manual cleaning practices for any imperfection in procedure. We spent way too much time seriously discussing the possibility that:
Also- What’s the most obvious non-sterile aspect of these rooms? People! The team’s hypotheses were filled with different ways of blaming people.
Manpower flooded our 6M fishbone diagram. Blaming manpower is a pet peeve for me. But the most frustrating part- All hypotheses were investigated individually when we could have addressed them all as a single question: Could contamination from an unseen/unnoticed source in Room 1 or Room 2 have caused our OOL Results? For perspective on that question, let's do some math! 250 colonies is the limit that can be visually differentiated on a test plate. When there are more colonies on the plate, they start to grow into each other. Recoveries greater than 250 are considered too numerous to count. Therefore, test results were documented as >250 CFU(colony forming units)/mL Multiply 250 CFU/mL by 1000mL/L, and you have 250,000 CFU per liter. A batch of this raw material is 7000 liters. Assuming the organism was evenly distributed (based on our ultimate root cause, it likely was), we had 1,750,000,000 CFUs. That’s over 1 billion colony forming units in the pooling vessel at the time of sample collection. Billion, with a B. The background for this next value gets a little fuzzy, so reach out to me if you want to know my reasoning on it. A small, single colony of Bacillus on a test plate contains roughly (very roughly) 1 million cells. That means a single test filter covered in Bacillus contains about 250 million bacterial cells. Remember the Bacillus Bunny? check it out to see what 250 million bacterial cells looks like. Test filters are about the size of the Bacillus Bunny’s belly. Imagine taking seven test filters covered in Bacillus, scraping all the organisms off, then rolling that mess into a ball. It’d be roughly the size of a large marble. That’s what 1.75 Billion CFUs would look like with no vector (dirt, water, fabric, etc…) involved.
The entire team of microbiologists should have been extremely skeptical of any root cause hypothesis that required this much bacteria to be introduced during the manufacturing process. That level of contamination doesn’t happen when an operator holds a non-sanitized glove over an open tank (or any of the other guesses above). We should have been especially skeptical of that much bioburden being introduced to the product stream without the vector being noticed. It’s possible some proliferation occurred between the cleaning cycle and sample collection. But the temperature of the manufacturing lines was controlled at 0°C. Organisms can grow at that temperature, but a quick change to such a stressful environment is hard on microbes. They are not likely to grow to such huge levels so quickly after that transition. I was met with some resistance when I pushed back against the momentum of the investigation. According to our black belt facilitator, we were to follow up on all brainstorming outcomes. Resisting that made me look like I wasn’t a team player. Also, I couldn’t say making the process cleaner was a bad thing. The team had a lot of comfort improving what they could control, especially when we were finding less than optimal practices. But cleaning up non-sterile practices wasn’t the goal of the investigation. This process was designed to function in a non-sterile environment. We needed to know why our counts were so consistently high. After the 2nd failing commercial run, the team started to feel defeated with their efforts. As the team got more desperate, my idea for a unique test got some traction. I drew from experience with CIP cleaning validations to design a test that finally gave us a meaningful lead. You’ll get to read all about it in Part 4! Also, Part 5 is now complete! Credit to this ABC News report where I found the Bacillus Bunny picture. It was originally posted on the American Society for Microbiology's facebook page. |