|
I apologize in advance. This post is BORING (Although I’m proud of the cliff hanger ending). We get into the weeds of kinetic-chromagenic test equipment and how it determines endotoxin levels in a sample. This background is needed to understand the craziness of what happened. This is the 2nd part of a 3 part series. Part 1 discussed WFI system endotoxin contamination. The endotoxin came from pre-treatment water. We always had some level of endotoxin in the city water, but we wanted to know why we didn’t see it on two particular days. I believed I could answer that question by looking at the “unofficial” raw data from the test. The test measures endotoxin in a cool way. When the purified horseshoe crab blood (lysate) mixed with endotoxin, it turned the solution yellow. The equipment measured the yellow intensity throughout the test. The faster the samples turned yellow, the more endotoxin was there. When a sample reached a certain threshold, we said it “reacted” We tested with a 96 well plate like this: 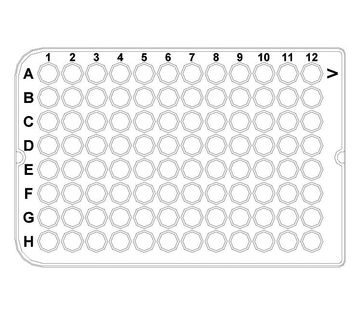 We added samples + lysate to each of those wells. When the test was done, the plate had a bunch of different shades of yellow. I made a mock-up in excel of what it kinda looked like. This shows what a plate with 9 samples looked like when it was done. (A plate could fit 20 samples if needed): 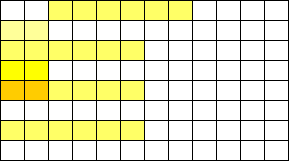 And this is what those shades represented: 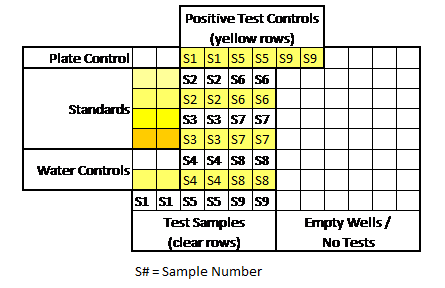 An official report was generated after each test. Results from the report were really the only thing management cared about. Those results allowed us to release a lot or confirm WFI was acceptable for use. But what else was on that report?
Some measurements had to line up for the entire test plate to be valid. A test plate was only valid if all the following occurred:
If we had a problem with any of those, the entire assay had to be repeated. Other weird stuff could happen too. Things like hot wells (when a single well reacted when it wasn’t expected to) required us to repeat individual tests. It was miserable when I got a hot well at the end of my shift. I’d be stuck at work for another hour. All information discussed above was on each final test report. What else could possibly be gathered from the raw data? During the test, every 2 minutes, the machine measured the intensity of yellow in each test well. The raw data contained all those measurements, plus a graph for each of those measurements over time. When I tested, I watched these graphs in real time hoping nothing looked out of the ordinary. The examples below show what those graphs looked like over the course of an assay. Remember, each little square is a graph for a corresponding well on the plate. 6 minutes in: The most concentrated standard started to turn yellow. Those tiny marks on the fifth row down represent a slight elevation in yellowness compared to the first measurement taken. No changes are detected for the other wells. At this time, the plotted lines are indistinguishable from the X axis for those wells. 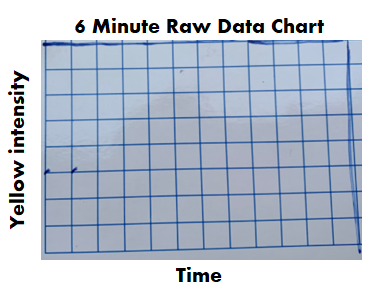 16 minutes in: The most concentrated standard has reached the reaction threshold. It will continue to increase in yellow intensity (which explains why it looks darker when the assay is complete), but any further change is irrelevant to the assay. The 2nd most concentrated standard is almost at the threshold. The color change for the 3rd standard and positive controls are just starting to be detected. 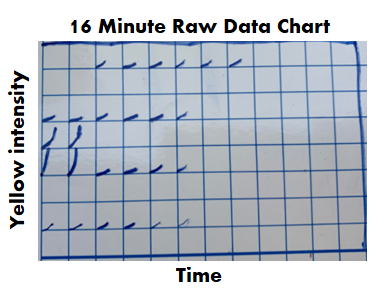 36 minutes in: Every standard and control has reached the threshold except for the most dilute standard. What’s interesting here- we see all the tests and negative controls start to change color. That’s right! Lysate will turn yellow on its own over time, even if no endotoxin is there! 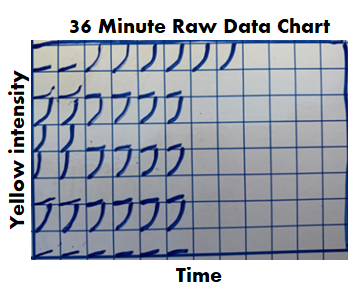 46 minutes in: The assay is complete. The final graph doesn’t look much different than the 36 minute graph: 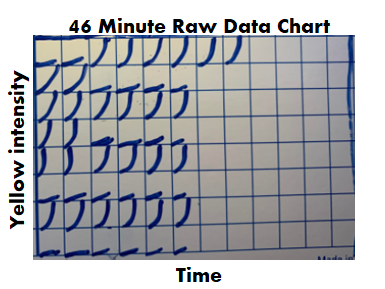 Phew! The background is all laid out. I can finally explain what I expected to see for those 2 city water samples with no endotoxin. I thought the graphs for the duplicate test wells would look like the circled wells here: 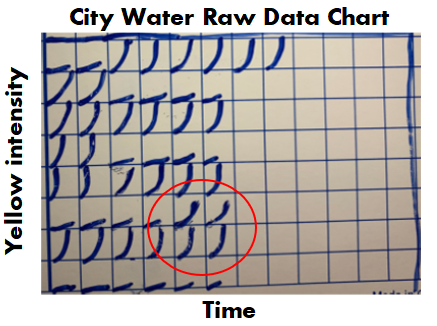 To me, those graphs say some endotoxin was there, it just wasn’t enough to meet the threshold. The line rose faster than the negative control samples, but the endotoxin level was just below the most diluted standard we tested.
For one of the 2 days in question, that was exactly what I saw. It completely made sense. Endotoxin levels were just a bit lower than the low end of our normal range. If the lowest standard had 0.05 EU/mL, this city water sample probably had 0.03 EU/mL. No big deal. On the other day in question, I saw . <-- I fill in that blank in Part 3. (If you really paid attention, you’ll know how this isn’t a cliff hanger).
0 Comments
Leave a Reply. |
